South Carolina General Population poll of 1434 (weighted) respondents (MOE +/-2.59%)
Results
ROCK HILL, SOUTH CAROLINA – A majority of South Carolina residents rate today’s economy as bad with half saying that they are not as well off financially as they were a year ago, according to the latest Winthrop Poll.
Other results from the survey of South Carolinians:
See full results, commentary, and methodology below.
For additional information or to set up an interview with Scott Huffmon, contact Judy Longshaw at longshawj@winthrop.edu or 803/323-2404 (office) or 803/984-0586 (cell).
Results
The Economy (Tables 1-8)
Food, gas and housing prices have risen in the last year across the nation, causing many to struggle to make key decisions about their household expenses.
A quarter of poll takers said they rate the economy as very bad, while another 37% called it fairly bad. With only 1 out of every 5 saying they are better off than a year ago, nearly half said they are not as well off.
Respondents gave mixed responses in what the economy would look like a year from now: better, 28%; worse, 38%; about the same, 23%; and 11% said they don’t know.
Paying for food is difficult or very difficult for 67%, while only 28% said it was easy or very easy. Nearly a third said health care costs are difficult to afford, while about 25% said it was very difficult.
Housing is another issue that S.C. residents have concerns about. Around 60% find rent or mortgages as difficult to afford. Luxuries, such as eating out for dinner, are not in the spending plan for 61% of respondents, while a week-long vacation is unaffordable for 72%.
Additional Analysis from Winthrop Poll Director Scott Huffmon: “As the South Carolina legislature wrestled with Donald Trump’s call to redraw South Carolina’s congressional district lines (the S.C. general population opposed the broad concept of gerrymandering; see Tables 10-13 here: https://www.winthrop.edu/winthroppoll/2025-november-winthroppoll-results-2.aspx), South Carolinians continue to struggle with the economy. Additionally, S.C. residents are not hopeful about the future. Nearly half report being worse off financially than last year and more than 6 in 10 believe the national economy will be worse or the same a year from now, which matches the percent who rate the current condition of the economy as bad. When nearly 7 in 10 find groceries difficult to afford and almost 60 percent struggle with both healthcare and housing costs, SC residents may wonder at the herculean efforts to address national political issues while many in the state feel pushed to the economic brink. However, given that the dramatic rise in the costs of goods and services is driven by national forces, there is little that South Carolina legislators could do to address the root causes of the inflation that South Carolinians struggle with. Things that may have been seen as simple pleasures in the past, such as taking an annual vacation or occasionally going out to dinner, feel out of reach for most South Carolinians. Far too often, it seems that the only polls that seem to matter are of likely voters for the next election; very often, that obscures the opinions and daily struggles of the typical South Carolinian.”
U.S. Citizen Qualification (Tables 9 and 10)
The opinions of poll takers in South Carolina are close to those found nationwide in a Pew Survey of U.S. Adults in April.
Both S.C. Republicans and Democrats said at a rate of 98% that people born in the U.S. to parents who were born in the U.S. should be considered U.S. citizens. Support dropped to 84% for those whose parents immigrated legally. National support was higher at 94%.
Support fell even further for U.S. citizenship for those who were born in the U.S. to parents who immigrated illegally. In S.C., 25% of Republicans said yes, while 66% of Democrats said yes. The Pew Survey found that half of U.S. adults said yes, the other half said no, with 3 out of 4 Republicans giving a no response.
When asked whether having an increasing number of people of different races, ethnic groups and nationalities makes the U.S. a better place, 46% said yes, with 31% saying it doesn’t make much difference. Democrats were more likely to say yes, with 62% affirming, while 35% of Republicans did.
Additional Analysis from Winthrop Poll Director Scott Huffmon: “While South Carolinians essentially match national attitudes regarding the citizenship of those born in the U.S. to parents also born in the U.S., the state begins to diverge from national opinion when it comes to citizenship for other groups. While an overwhelming majority of South Carolinians believe people born in the U.S. to legal immigrants should be citizens, it is still 10 points lower than national opinion. The results are more interesting when it comes to people born on U.S. soil to those who immigrated illegally. While South Carolinians in general are less supportive of citizenship for those born to illegal immigrants than those nationwide, it is Democratic attitude that drives the difference. Only 1 in 4 S.C. Republicans support birthright citizenship for those born to illegal immigrants, which mirrors national Republicans exactly. However, while a majority of S.C. Democrats support birthright citizenship for children born to illegal immigrants, it is fully 8 points lower than the numbers for national Democrats.”
Confederate Monuments, Flags and the Civil War (Tables 11-13)
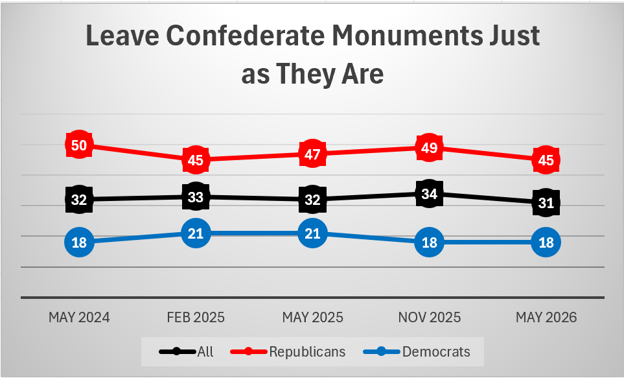
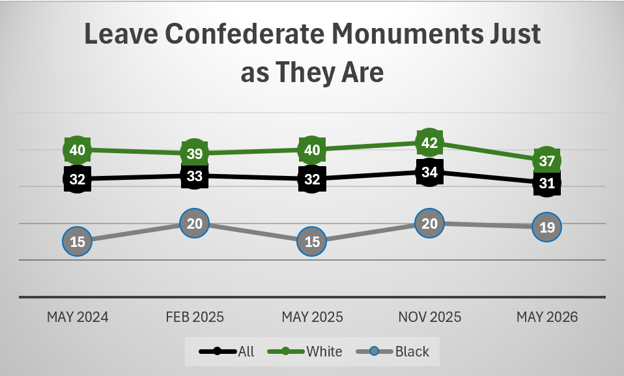
Winthrop Poll respondents were divided when asked about how to handle monuments to Confederate soldiers who died during the Civil War. Nearly a third said to leave them alone, with 37% of white respondents and 45% Republicans giving that response. Another 34% of all respondents said to leave them alone but add a marker for context, with 38% of white respondents, 24% of Black respondents and 37% of Republicans agreeing.
A third option was to move the monuments to a museum. Seventeen percent of all respondents agreed with this idea, while 14% of white and 25% of Black respondents did.
When asked about the symbolism of the Confederate battle flag, 24% said it created racial conflict, 34% said it represented Southern pride, while 31% said it was equally both. Of Black respondents, 41% said the flag meant racial conflict while 36% said it was equally conflict and pride.
Half of all poll takers, including white and Black respondents, Republicans and Democrats, said the Civil War was equally fought about slavery and states’ rights. Twenty-two percent said it was due to slavery, while one in 10 didn’t know.
Additional Analysis from Winthrop Poll Director Scott Huffmon: “The fate of Civil War monuments has been in the South Carolina news recently as the legislature has made it nearly impossible to do anything regarding the monuments other than leaving them as they are. Despite the fact that the legislation is broadly worded to essentially cover all historical monuments, it would be disingenuous to suggest that this legislation was focused on anything other than protecting Confederate monuments. This is an example of where the attitudes of the general public diverge from those of the majority party that pushed through this legislation. This legislation would require Confederate monuments to be basically left just as they are. This is a position that only 3 in 10 South Carolinians agree with. In fact, slightly less than half of those who identify as Republican in the general population agree with this position. However, this appears to be one of the many issues where the constituency that matters is not the general public or even people in the general public who identify with your party. The constituency that matters in highly gerrymandered state legislative districts such as ours are the strong and committed partisans who vote in the primary. For Republicans, this means the strongest conservatives in the party, and we can see that even in the general population, partisanship has an even larger impact on attitudes concerning Confederate monuments than race. For many, the constant focus only on likely voters in partisan primaries makes it difficult to remember that there may be people who identify with their own party who believe differently than this subgroup within a subgroup.”
Arts (Tables 14-17)
The arts and culture are important to a large majority of South Carolinians. Nearly 75% said it was either very or somewhat important.
Respondents wanted students in all levels, from pre-kindergarten to 12th grade, to receive an education about the arts, say through dance, media arts, music, theater, visual arts and literature.
For elementary school, 82% felt it was very important or somewhat important. The numbers remained elevated for both middle and high school educations.
Additional Analysis from Winthrop Poll Director Scott Huffmon: “Of late, there have been ongoing political battles over what should be taught to South Carolina’s K-12 students. While an overwhelming majority of South Carolinians believe that it is important that elementary school students receive an education in the arts (including dance, media arts, music, theater, visual arts, and literature) the number is still 11 points lower than national opinion. The gaps persist but are halved when asked about the importance of an education in the arts for middle school and high school students. Even though large majorities in SC support arts education, this could be interpreted as fewer South Carolinians believe education in the arts is important compared to the nation as a whole. However, we can’t discount the possibility that the wording of the 2023 Ipsos poll tripped over a political hot button issue in the state. A prominent focus of groups such as Moms for Liberty and others in South Carolina have been what books are appropriate to be housed in school libraries. Replicating the exact wording of the national poll, which includes the term ‘literature,’ may have triggered concerns about appropriate children’s literature among some respondents. If so, it becomes impossible to tell if there is a true difference between South Carolina and the nation with regard to arts education, broadly defined. Whether that is the case or not, it is obvious that the vast majority of South Carolinians see value in students receiving some education in the arts.”
Methodology
The Winthrop Poll is sponsored by the Center for Public Opinion & Policy Research
at Winthrop University which funds the poll. Distributed online in April and May,
the poll has a sample size of 1,434 respondents (weighted) with a margin of error
of +/-2.59% at the 95% confidence level. Full methodology is at the bottom of the
results page.
RESULTS MAY NOT SUM TO 100 DUE TO ROUNDING
NOTE: This is a GENERAL POPULATION poll, NOT a poll of Likely Voters or Registered Voters. Especially note that General Population polls contain more Independents, more Moderates, more who respond with ‘Not Sure,’ and fewer respondents who follow politics closely than Likely Voter polls.
NOTE: Political Independents are included in “All Respondents” and do not always have attitudes “in between” Republicans and Democrats. They are also often more likely to respond to questions with Not Sure or No Answer.
How would you rate the condition of the economy today?
|
|
All Respondents |
|
Very Good |
7 |
|
Fairly Good |
26 |
|
Fairly Bad |
37 |
|
Very Bad |
25 |
|
Not Sure |
6 |
Would you say you, yourself, are better off financially than you were a year ago, not as well off, or in about the same shape financially?
|
|
All Respondents |
|
Better off |
21 |
|
Not as well off |
48 |
|
About the same |
31 |
A year from now, do you expect that economic conditions in the country as a whole will be..
|
|
All Respondents |
|
Better |
28 |
|
Worse |
38 |
|
About the same |
23 |
|
Don't Know |
11 |
How affordable do you find the following?: Grocery costs
|
All Respondents
|
|
|
I find this very easy to afford |
6 |
|
I find this easy to afford |
22 |
|
I find this difficult to afford |
45 |
|
I find this very difficult to afford |
22 |
|
N/A - I do not have to spend on this |
2 |
|
Don't Know |
3 |
How affordable do you find the following?: Health care costs (e.g. insurance costs, prescription medication)
|
All Respondents
|
|
|
I find this very easy to afford |
8 |
|
I find this easy to afford |
19 |
|
I find this difficult to afford |
32 |
|
I find this very difficult to afford |
27 |
|
N/A - I do not have to spend on this |
9 |
|
Don't Know |
4 |
How affordable do you find the following?: Housing costs (e.g. rent, mortgages)
|
All Respondents
|
|
|
I find this very easy to afford |
7 |
|
I find this easy to afford |
18 |
|
I find this difficult to afford |
27 |
|
I find this very difficult to afford |
31 |
|
N/A - I do not have to spend on this |
14 |
|
Don't Know |
4 |
Thinking about your household budget and the cost of things these days, would you describe going out to dinner as affordable or unaffordable?
|
All Respondents |
|
|
Affordable |
39 |
|
Unaffordable |
61 |
Thinking about your household budget and the cost of things these days, would you describe taking a week long vacation as affordable or unaffordable?
|
All Respondents |
|
|
Affordable |
28 |
|
Unaffordable |
72 |
In your view, should each of the following be considered U.S. citizens
People born in the U.S. to parents who were born in the U.S.
|
All Respondents |
Republicans |
Democrats |
|
|
Yes |
97 |
98 |
98 |
|
No |
3 |
2 |
2 |
People born in the U.S. to parents who were born in the U.S.
|
All U.S. Adults |
|
|
Yes |
95 |
|
No |
4 |
People born in the U.S. to parents who immigrated legally.
|
All Respondents |
Republicans |
Democrats |
|
|
Yes |
84 |
83 |
85 |
|
No |
16 |
17 |
15 |
People born in the U.S. to parents who immigrated legally.
|
All U.S. Adults |
|
|
Yes |
94 |
|
No |
5 |
People born in the U.S. to parents who immigrated illegally.
|
All Respondents |
Republicans |
Democrats |
|
|
Yes |
45 |
25 |
66 |
|
No |
55 |
75 |
34 |
People born in the U.S. to parents who immigrated illegally.
|
All U.S. Adults |
Republicans |
Democrats |
|
|
Yes |
50 |
25 |
74 |
|
No |
49 |
75 |
26 |
Overall, do you think having an increasing number of people of many different races, ethnic groups and nationalities makes the U.S. a better place or a worse place to live, or doesn't make much difference either way?
|
All Respondents |
Republicans |
Democrats |
|
|
Better place |
46 |
35 |
62 |
|
Worse place |
15 |
22 |
10 |
|
Doesn't make much difference |
31 |
34 |
22 |
|
Not sure |
9 |
8 |
6 |
Which of the following comes closest to your opinion about what to do with monuments or memorials to Confederate soldiers who died during the Civil War? [Items 1-4 Randomized]
|
|
All Respondents |
White Respondents |
Black Respondents |
Republicans |
Democrats |
|
Leave them just as they are |
31 |
37 |
19 |
45 |
18 |
|
Leave them, but add a plaque or |
34 |
38 |
24 |
37 |
30 |
|
Move them to a museum |
17 |
14 |
25 |
7 |
29 |
|
Remove them completely |
9 |
4 |
18 |
3 |
17 |
|
Not sure |
9 |
8 |
15 |
7 |
7 |
Some people say the confederate battle flag reminds them of white supremacy and racial conflict. Other people say the confederate battle flag is a symbol of southern heritage and pride. Do you think the flag is more a symbol of racial conflict or of southern pride? [Items 1-2 Randomized]
|
|
All Respondents |
White Respondents |
Black Respondents |
Republicans |
Democrats |
|
Racial conflict |
24 |
15 |
41 |
9 |
39 |
|
Southern pride |
34 |
48 |
9 |
60 |
13 |
|
Equally both |
31 |
27 |
36 |
25 |
38 |
|
Not sure |
11 |
10 |
14 |
6 |
10 |
In your opinion, was the Civil War mainly about slavery, mainly about states’ rights, or about both equally? [Items 1-2 Randomized]
|
|
All Respondents |
White Respondents |
Black Respondents |
Republicans |
Democrats |
|
Slavery |
22 |
18 |
25 |
15 |
34 |
|
States' rights |
17 |
21 |
12 |
24 |
8 |
|
Equally both |
50 |
51 |
50 |
51 |
50 |
|
Not sure |
11 |
10 |
14 |
11 |
8 |
In general, how important are arts and culture to you personally?
|
All Respondents |
National Ipsos |
|
|
Very important |
34 |
32 |
|
Somewhat important |
39 |
44 |
|
Not very important |
15 |
15 |
|
Not at all important |
6 |
7 |
|
Don't know |
6 |
1 |
Thinking about pre-K to 12th grade students, in your opinion, how important is it that students receive an education in the arts (including dance, media arts, music, theater, visual arts, literature) during the following? - Elementary School
|
All Respondents |
National Ipsos |
|
|
Very important |
53 |
65 |
|
Somewhat important |
29 |
28 |
|
Not very important |
10 |
4 |
|
Not at all important |
4 |
1 |
|
Don't know |
5 |
2 |
Thinking about pre-K to 12th grade students, in your opinion, how important is it that students receive an education in the arts (including dance, media arts, music, theater, visual arts, literature) during the following? - Middle School
|
All Respondents |
National Ipsos |
|
|
Very important |
52 |
63 |
|
Somewhat important |
34 |
30 |
|
Not very important |
7 |
4 |
|
Not at all important |
3 |
1 |
|
Don't know |
5 |
2 |
Thinking about pre-K to 12th grade students, in your opinion, how important is it that students receive an education in the arts (including dance, media arts, music, theater, visual arts, literature) during the following? - High School
|
All Respondents |
National Ipsos |
|
|
Very important |
57 |
62 |
|
Somewhat important |
28 |
27 |
|
Not very important |
8 |
7 |
|
Not at all important |
4 |
2 |
|
Don't know |
4 |
3 |
AAPOR Transparency Initiative Disclosure
May 2026 Winthrop Poll
| Disclosure Elements | Answers |
| 1. Data Collection Strategy | Survey |
| 2. Who Sponsored the Research and Who Conducted It | The Center for Public Opinion & Policy Research at Winthrop University, funded by Winthrop University |
| 3. Measurement Tools/Instruments | Full questionnaire available upon request. |
| 4. Population Under Study | General 18+ population of South Carolina |
| 5. Method Used to Generate and Recruit the Sample | The sample includes a non-probability sample from an online panel curated by ReconMR. See (6) below for more information. |
| 6. Method(s) and Mode(s) of Data Collection |
Respondents to the online survey were contacted via email to participate in the survey,
which was programmed in Qualtrics. Respondents could participate in the survey via
computer or smartphone.ReconMR survey methodology includes:
--Digital Fingerprinting and Fraud Identification --Ability to flag professional survey takers from outside Panel sources --Text Analytics designed to identify fraudulent or suspicious Open-end responses --Ability to verify email address validity from client lists and other non-panel sample --Built-in digital identification to prevent sending invites to respondents who have already visited the survey Surveys were conducted in English. |
| 7. Dates of Data Collection | April 29-May12, 2026 |
| 8. Sample Sizes (by sampling frame if more than one frame was used) and (if applicable) Discussion of the Precision of the Results | Sample size: 1,434 Margin of Error (MOE): +/-2.59 at the 95% confidence level for results using all respondents; all subgroups will have a higher MOE. |
| 9. How the Data Were Weighted | Data were weighted on sex, race, age, and education based on data from the US Census Bureau for General Population results. |
| 10. How the Data Were Processed and Procedures to Ensure Data Quality | For the online survey, validity checks included one attention check question, one bot detection question, removal of respondents who did not meet the age requirements, removal of straight-lined results, removal of respondents who took under 6.5 minutes or over 30 minutes, removal of respondents who quit 2/3 of the way through the survey. See ReconMR data quality procedures in (6) above. Data was processed in SPSS. Age and race categories were created and recoded by humans to match data from the US Census Bureau American Community Survey |
| 11. A General Statement Acknowledging Limitations of the Design and Data Collection | All survey research contains unmeasured error and results should be seen as informative – not definitive. |